Relationship between perceived fatigability and the values of biological and biometric markers in young professional and amateur rugby players during a sporting season Relation entre le niveau de fatigue perçue et les valeurs de marqueurs biologiques et biométriques chez des jeunes rugbymans professionnels et amateurs au cours d’une saison sportive
Antoine Chiere ,
Oyéné Kossi ,
Jennifer Teinturier ,
Anne Alaphilippe ,
Martine Duclos
et Stéphane MANDIGOUT
Objectives: The aim of our study was to investigate the relationship between the level of perceived fatigability and the values of biological and biometric markers in young professional and amateur rugby players during a sporting season.
Materials and methods: The study was conducted on 30 rugby players divided into an amateur (12) and a professional (18) group. Fat mass, creatine kinase and aspartate aminotransferase were measured for 9 months in each player before they completed the french society of exercise and sports medicine overtraining questionnaire. Statistical analysis was performed and the significance level was set at 5%.
Results: The higher the percentage of body fat the athletes have, the higher the questionnaire score (r= 0.14, p < 0.01). Plasma creatine kinase and aspartate aminotransferase concentrations were negatively correlated with overtraining score (creatine kinase: r= -0.15, p= 0.03; aspartate aminotransferase: r= -0.11, p= 0.03).
Conclusion: Our study has shown that there is a negative correlation between our biological markers and the perceived fatigue score and a positive correlation between body fat and the same score. Further work is required to determine whether creatine kinase, aspartate aminotransferase and percentage of body fat can really be markers of fatigue or even markers of recovery (creatine kinase) in order to make the best use of them in the monitoring of rugby players.
Objectifs : L’objectif de notre étude était d’évaluer la relation entre le niveau de fatigue perçue et les valeurs de marqueurs biologiques et biométriques de jeunes rugbymans professionnels et amateurs au cours d’une saison sportive.
Matériels et méthodes : L’étude a été réalisée sur 30 joueurs de rugby répartis en un groupe amateur (12) et professionnel (18). La masse grasse, la créatine kinase et l’aspartate aminotransférase ont été mesurées pendant 9 mois chez chaque joueur avant qu’il remplisse le questionnaire de surentraînement de la société française de médecine du sport.
Résultats : Plus le pourcentage de masse grasse est important, plus le score au questionnaire était élevé (r= 0.14, p < 0.01). Les concentrations plasmatiques de créatine kinase et d’aspartate aminotransférase étaient corrélées négativement au score de surentrainement (créatine kinase : r= -0.15, p= 0.03 ; aspartate aminotransférase : r= -0.11, p= 0.03).
Conclusion : Notre étude a permis de montrer qu’il existe une corrélation négative entre nos le score de fatigue perçue et certains marqueurs biologiques d’une part et une corrélation positive avec la masse grasse d’autre part. D’autres travaux seront à mener afin de savoir si la créatine kinase, l’aspartate aminotransférase et le pourcentage de masse grasse peuvent réellement être des marqueurs de fatigue voir des marqueurs de récupération (créatine kinase) afin de les utiliser au mieux dans le suivi des rugbymans.
Adresse de correspondance
Stéphane Mandigout
UR HAVAE 20217
123 Av Albert Thomas
87060 Limoges.
France
Mail : stephane.mandigout@unilim.fr
Introduction
The introduction of professionalism in rugby has led to an increase in high-intensity activities. The game has become faster and more physical [1]. The physical condition of the players being notably conditioned by intensive trainings [2], the increase in their rate and games coincides with an increase in injuries [3] which are increasingly severe [4]. Tackling is one of the main causes [4] from accumulated physical fatigue [5]. Early detection of fatigue in rugby players could optimize their performance by reducing the probability of injury and the risk of overtraining [6].
This fatigue is defined as a limitation in cognitive and physical capacity as a result of interactions between perceived fatigue and performance-related fatigue. Perceived fatigue indicates a change in the athlete's perceptions. It can be assessed by means of questionnaires [7] including the overtraining questionnaire of the French Society of Medicine and Sports (SFMS) [8]. Performance-related fatigue expresses a decrease in performance measured objectively over time. It can be quantified as a decrease in physical capacity [7].
The scientific literature is equivocal regarding the description of fatigue. However, its physiological mechanisms remain unclear. Simple biological markers such as creatine kinase (CK) and aspartate aminotransferase (ASAT) have been proposed to assess fatigue in athletes [9,10]. Indeed, the release of these enzymes is triggered by damage to muscle tissue [11,12].
In addition, an increase in CK coupled with a decrease in sport tolerance may be considered a marker of an overtraining state [13,14]. Thus Coutts et al. found a decrease in performance associated with a significant increase in CK compared to the basal resting level in rugby players undergoing intensive training, indicating an overtaking state [15].
In the same way, Gabbett [16] argues that the increase in body fat over the course of a sports season is a reflection of physical deconditioning that impairs performance.
These markers are often used to determine fatigue, however, to our knowledge only one study evaluates their kinetics during a rugby sport season. In this study, Alaphillipe et al. [17] found a positive correlation of the CK marker (r=0.3; p<0.01) with the SFMS overtraining score and no correlation with the ASAT score during a season.
Protecting the health of athletes is a major concern, but objective detection of fatigue is limited by the lack of a universal marker that combines perceived and performance-related fatigue [18].
The objective of our study was to evaluate the relationship between the level of perceived fatigue and the values of biological and biometric markers of young professional and amateur rugby players during a sports season. Based on the assumption that accumulated fatigue and markers of muscle damage could compromise sport performance [19], we hypothesize that there is a correlation between biological markers and the score of the SFMS overtraining questionnaire during a sports season.
Material and method
Design
The study conducted was a prospective longitudinal study of 30 amateur and professional rugby players.
Participants
The rugby players were divided into an "amateur" group (A) made up of players from the first team of Isle Sur Vienne playing in the third national division and a professional group (P) made up of hopefuls from the Club Athlétique Brive Corrèze Limousin. The A group trained twice a week while the P group trained five times a week in addition to weight training. The schedule for both teams included 18 games during the year, not including friendly and finals games.
The rugby players were all in school, university or vocational training in parallel with their sporting careers.
We included amateur and adult rugby players for group A and those under 22 years old for group P. We excluded those with a contraindication to sport at the beginning of the study. All procedures related to the experimentation followed the recommendations of the institutional ethics committee in accordance with the guidelines for good clinical practice of the Declaration of Helsinki. This project has received the authorization of the committees for the protection of individuals (RCB: 2009-A00674-53).
Intervention
The evaluations were conducted over a sports season from July to April. They were done once a month during the rest period until August for group A and July for group P. Similarly, they were taken during the preparation period until September for both teams and then twice a month until the end of the study (Table 1).
Figure 1: Planning evaluations over the sporting season
|
TEST |
1 |
2 |
3 |
4 |
5 |
6 |
7 |
8 |
9 |
10 |
11 |
12 |
13 |
14 |
15 |
16 |
17 |
18 |
|
Sports season period |
Off season – Before sports season |
First sports season 1 game/week |
Christmas break |
Second sports season 1 game/week |
||||||||||||||
|
Year |
2009 |
2010 |
||||||||||||||||
|
Date |
16/07 |
17-18/08 |
31/08-01/09 |
14-15/09 |
28-29/09 |
12-13/10 |
2-3/11 |
16-17/11 |
30/11-1/12 |
14-15/12 |
4-5/01 |
18-19/01 |
1-2/02 |
22-23/02 |
15-16/03 |
29-30/03 |
19-20/04 |
3-4/05 |
|
Biometrics |
x |
x |
x |
x |
x |
x |
x |
x |
x |
x |
x |
x |
x |
x |
x |
x |
x |
x |
|
Blood |
x |
x |
x |
x |
x |
x |
x |
x |
x |
x |
x |
x |
x |
x |
x |
x |
x |
x |
|
Urine |
x |
x |
x |
x |
x |
x |
x |
x |
x |
x |
x |
|||||||
|
Questionnaire |
x |
x |
x |
x |
x |
x |
x |
x |
x |
x |
x |
x |
x |
x |
x |
x |
x |
x |
Measurements were taken 48 hours after their respective games.
Criteria evaluated
Anthropometric characteristics
For each group, a measurement of the body weight of each subject was made at each test, on the same electronic scale, the values being given to ± 100 grams, by digital display.
Fat mass was measured by the "4-fold" technique at each evaluation with a Harpenden forceps [20]. Siri's equation was then used to obtain the percentage of body fat [21].
Blood biochemistry
A measurement of ASAT and CK was performed at each test from capillary blood taken on a heparin microtube after sterile puncture (single-use needle, cleaning and disinfection of the puncture area) of a finger, by photometric techniques. The device used was a Reflotron, already used by different authors for the biological monitoring of athletes [22]. The system was cleaned and checked every 100 measurements, using the Reflotron Check, a control strip to verify the proper functioning of the measuring system.
Evaluation of fatigue by questionnaire
During the examinations, the subjects completed the SFMS questionnaire consisting of 54 binary response items (yes/no) to calculate the overtraining score. It assessed perceived fatigue [8].
Statistical analysis
The statistical analyses were made with the software R version 3.5.2 and the graphs were made in ggplot thanks to the package "tidyverse". The results will be expressed in the form of median and quartiles for quantitative variables or proportion for qualitative variables.
A simple descriptive analysis was performed on the whole study population and then by subgroups ("Professional" and "Amateur").
To meet the objective of the study, a Spearman-type correlation analysis was performed to determine the factors associated with the fatigue score. The rules of interpretation of the correlation coefficient followed the recommendations of Hinkle [23]. The Shapiro-Wilk test showed that the distribution of the data is significantly different from that of a normal population; therefore, nonparametric tests were preferred over parametric tests. To assess the significance of differences in variables over the season or between subgroups, we performed comparisons of means using Student's t-test or the nonparametric Mann-Whitney test depending on the distribution of the variable.
For all analyses, the significance level was set at alpha = 0.05.
Results
Population
The main characteristics of the population are summarized in Table 2.
Table 2: Caracteristics of the sample. A: Amateur; P: Professionnal; BMI: Body mass index; BF: Body fat; CK: Créatine Kinase; ASAT: ASpartate AminoTransférase.
|
A Median [P25, P75] |
P Median [P25, P75] |
|
|
Sample |
12 |
18 |
|
Age (an) |
20.2 [19.9 ; 21.6] |
20.3 [19.6 ; 21.0] |
|
BMI |
26.4 [24.1 ; 30.2] |
27.5 [25.7 ; 29.6] |
|
BF |
16.9 [14.0 ; 23.6] |
12.6 [9.8 ; 152] |
|
CK |
165.5 [119.0 ; 253.0] |
412.0 [278.0 ; 666.0] |
|
ASAT |
20.5 [15.9 ; 27.9] |
22.5 [18.6 ; 28.0] |
|
Fatigue score |
3 [2 ; 3] |
2 [2 ; 3] |
Correlations between the SFMS score and the indicators assessed
Correlations are presented in Table 3. The higher the percentage of body fat in the athletes, the higher the questionnaire score was (r= 0.14, p < 0.01). Regarding plasma CK and ASAT concentrations, they were negatively correlated with the SFMS overtraining score (CK: r= -0.15, p= 0.03; ASAT: r= -0.11, p= 0.03).
Table 3: Corrélations entre le score du questionnaire de la SFMS et les trois indicateurs retenus dans le groupe. A : Amateur ; P : Professionnel ; MG : Masse Grasse ; CK : Créatine Kinase ; ASAT : ASpartate AminoTransférase
|
A (n = 12) |
P (n = 13) |
Total (n=25) |
||||
|
R |
P-value |
R |
P-value |
R |
P-value |
|
|
BF |
0.19 |
0.01 |
-0.07 |
0.29 |
0.14 |
<0.01 |
|
CK |
-0.05 |
0.49 |
-0.15 |
0.02 |
-0.15 |
0.03 |
|
ASAT |
-0.09 |
0.29 |
-0.15 |
0.03 |
-0.11 |
0.03 |
Evolution of [CK] during the season
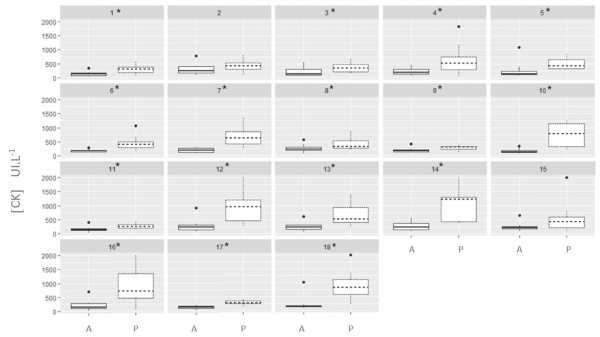
The Figure 2 shows a comparison of CK concentrations between the two rugby players groups. CK concentrations were significantly higher in group P than in group A, regardless of the time of the season.
Figure 2: Comparison of Creatine Kinase (CK) concentrations between the Professional and Amateur groups at each measurement time. * p<0.05
Evolution of [ASAT] during the season
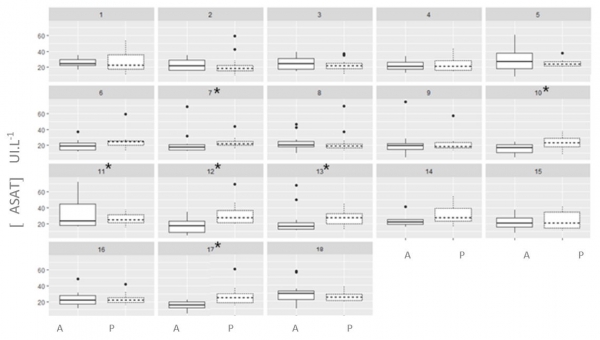
The ASAT concentration was significantly higher in P than A at T7 and T17 and during the Christmas break (T10/ T12/ T13) in P (p < 0.05) (Figure 3).
Figure 3: Comparison of Aspartate Amino Transferase (ASAT) concentrations between the Professional and Amateur groups at each measurement time. * p<0.05
Evolution of the percentage of fat mass during the season
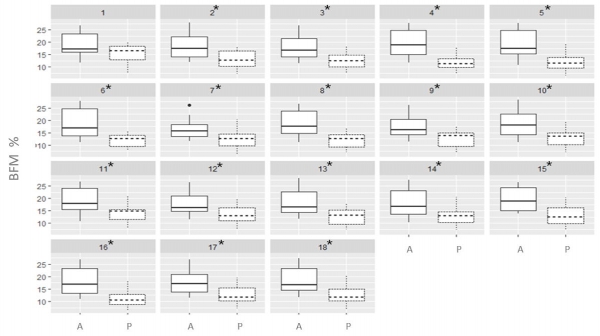
The evolution of the percentage of MG over the season is represented in Figure 4. A decreasing trend is observed in our athletes over the season (difference = -3%, p= 0.20). In addition, the percentage of MG was significantly higher in A from T2 to T18
Figure 4: Comparison of the percentage of body fat mass (BFM) between the Professional and Amateur groups at each measurement time. * p<0.05
Discussion
The aim of the study was to evaluate the relationship between subjective and objective markers of fatigue in rugby players over the course of a sports season. Our results show correlations between CK, ASAT, MG and the SFMS questionnaire for our population, suggesting that our biochemical and anthropometric parameters are potentially markers of fatigue.
CK and ASAT were negatively correlated with the fatigue score (CK: r=-0.15, p=0.03; ASAT: r=-0.11, p=0.03). It should be remembered that the concentrations of these parameters are of muscular origin and that their increase in the blood signifies the existence of muscle damage. Although some studies associate an increase in CK with muscle soreness [24,25] and fatigue [26,27], they are usually performed only after a match. Saw et al., in a review of the literature, found no correlation between objective measures, particularly CK, and subjective measures using questionnaires such as the RESTQ-S, the POMS or the SFMS questionnaire [9]. Similarly, Umeda et al. did not observe a correlation between ASAT and fatigue in female judoka [28]. Regarding MG, it is positively correlated with the SFMS questionnaire (MG: r=0.14, p<0.01). However, here, the low score of the questionnaire in general during the season does not allow to conclude.z
When we separate the A and P groups, we observe significantly negative correlations between CK and ASAT concentrations and the SFMS questionnaire in P players (CK: r=-0.15, p=0.02; ASAT: r=-0.15, p=0.03). These results contradict the study of Alaphillipe et al. carried out over a period of 6 months with young elite players where they found a positive correlation between CK and fatigue score (CK: r=0.297; p=0.01) and no correlation with ASAT [17]. As for group A, only the MG was positively and significantly correlated with the fatigue score (r=0.19; p=0.01). It seems that here again, the low fatigue felt by our workforce is a limiting factor for the interpretation of our results.
Concentrations [CK] [ASAT] and MG
Regarding the evolution of the concentration of the parameters, that of CK is high in the first weeks of preparation before decreasing during the season, suggesting an adaptation of the players to the collisions suffered during the preseason period [29]. It is also noted that it is higher in the P group than in the A group over all evaluation periods. It is likely that this difference is explained by the more frequent and intense muscular demands in the P group. As shown by Bouix et al. between gymnasts from the sports section and a control group [30]. The evolution of the concentration of ASAT (A and P) is relatively linear during the season, once again challenging the study of Alaphilippe et al. These authors indeed observed a progressive decrease of ASAT during the season, translating an adaptation of the players to the training [17]. In our study, the concentration of ASAT was particularly higher in P than in A during the Christmas break. We can explain these results by the regularity of the P in training, contrary to the A. Concerning the percentage of MG, our results show a slight tendency to decrease during the preparation period from T1 to T4 (-2.7%, p=0.10) in parallel with the increase in training. The players would be physically well prepared according to Dobbin et al. [31]. Moreover, this percentage evolves towards the decrease during the season supporting our idea that the training and the rhythm of the season were satisfactory not leading to deconditioning contrary to Gabbett [16] and Harley and al. [32]. Indeed, these authors had associated the increase in MG with a training load that was too high, leading to a physical deconditioning of the players. A higher percentage of MG was observed throughout the season in group A compared to group P. This difference can be explained by the frequency of training sessions associated with weight training and the nutritional context of the P players.
Practical application
How can we explain these differences in results between the Alaphilippe et al. study and our study, knowing that we were working with similar populations? The only methodological difference concerns the follow-up time, which was 9 months in our study and only 6 months in the Alaphilippe study. Moreover, the state of fatigue perceived by our population is questionable because the average score over the season in the SFMS questionnaire is 3.3/54 (+/- 2.6) with a minimum of 0 and a maximum of 15. As a reminder, Maso et al. set the cut-off point for overtraining at 20/54 in the SFMS questionnaire. [33]. And according to Brun [34], the normal score for this questionnaire is between 1 and 6, because an athlete always has a symptom present in the questionnaire. In our study, five athletes in group P regularly scored 0 on the questionnaire during the season. In addition, we know that the overtraining questionnaire tracks fatigue over the last two weeks. Thus, it is quite possible that if the score does not increase more, the explanation may also come from the choices of the coach who knows his players and who may rest them in view of a decrease in their performance.
[CK]: a marker of fatigue or recovery?
The optimal recovery time has been studied by the presence of muscle damage after physical activity. Baker et al. found that CK was elevated immediately after intense exercise and then decreased after a 24-hour recovery period [35], in contrast to two other studies where the CK concentration remained high for 24 hours [36] and 72 hours after [37]. Other authors found that muscle damage remained higher during the 72-hour recovery period after a soccer game [38] or rugby [27]. From these findings, we could consider CK as a marker of recovery and not as a marker of fatigue. The idea is that the high concentration of this parameter after exercise is related to performance. Thus, the basal value will be recovered within a few days or during a state of pathological fatigue by remaining abnormally high after stopping exercise. In this sense, Shearer et al. found a relationship between plasma CK concentrations and the measurement of the feeling of recovery assessed by a modified questionnaire of the Brief Assessment of Mood called BAM + Measuring Recovery following soccer games [39]. If CK levels increase when performance decreases following a match [40], we could think that the recovery is not complete and thus identify tools and means to improve these recovery phases.
Limits
Statistics
It should be kept in mind that a correlation allows for the description of simple relationships without addressing cause and effect. Especially since in a longitudinal follow-up study, baseline values of biological parameters may differ considerably between individual participants. Indeed, we could have considered the basal CK and ASAT of each player to analyze their evolution during the season. But the great inter-individual variability of these parameters and in particular of CK complicates the attribution of reliable reference values for athletes [11], especially since group P had followed an individual recovery program before starting the season. Therefore, our basal values were not standardized in our protocol.
Population
Our population size represents a small population with 30 players, but is still larger than the numbers in similar studies. We could have compared it with a third non-athletic group to validate CK kinetics and correlation with fatigue score. In addition, no position distinction was made to assess fat mass. Indeed, Morehen et al. found a wide variation in body fat, lean body mass and total body mass within the forwards and backs, making it difficult to establish a standardized profile specific to them [41].
Fatigue measurement
Our population is made up of young athletes who are competing, especially in group P, for promotion to the elite team. These athletes do not want to express their fatigue in an objective way for fear of not being promoted to the elite team on this parameter. Subjective questionnaires will always remain a limitation in studies because of this, but they should be used in combination with other parameters and athletes should be educated in their use.
Neither training load nor performance was measured in our study, which limited our conclusions about training-induced fatigue.
Conclusion
Our study showed that there is a negative correlation between the biological markers, CK and ASAT and the perceived fatigue score and a positive correlation between fat mass and the same. Despite the significance, the correlation coefficients are relatively low. One must therefore be cautious about the conclusions drawn. However, a very regular follow-up of these parameters would provide a lot of information for the technical and medical staffs concerning the physical condition of the players. Further work is needed to find out whether CK, ASAT and MG percentage can really be markers of fatigue or even markers of recovery (CK) in order to allow coaches to individualize training and recovery periods.