
B lymphocyte developmental analysis by fluorescence microscopy and flow cytometry
Contact
Claire Carrion, Ingénieure CNRS
B lymphocyte developmental analysis by fluorescence microscopy and flow cytometry.
The CRIBL laboratory focused on the B cell, whatever they are coming from mouse or human biopsies, and if they are normal or malignant. We have developed several routine protocols in flow cytometry and fluorescence microscopy to contribute to the analysis of the mouse models engineered by the transgenesis platform of the laboratory (or by the way of collaborations) and human samples coming from several biological sample collections. B cells undergo a continuous maturation from the very immature early stages in the bone marrow to the mature naive and activated B cells in periphery. To identify these different sub-populations in our murine and human samples is a key point to understand the mechanisms implicated in the normal and pathological development of these B cells.
Flow cytometry
Quantitative analysis of the murine and human B-cells: we have developed multi-parametric panels in flow cytometry to study and quantify the B-cell sub-populations in normal and transgenic mice. The same approach was developed to study the normal human bone marrow B-cells sub-populations (Adult Bone Marrow Three-Dimentional Phenotypic Landscape of B-cell, Carrion C. and al, Cytometry B Clin Cytom. 2019 Jan;96(1):30-38.). Moreover, we continuously developed specific panels to deal with specific questions from different projects from the lab.
New 3D analysis of the normal humanB-cell development :
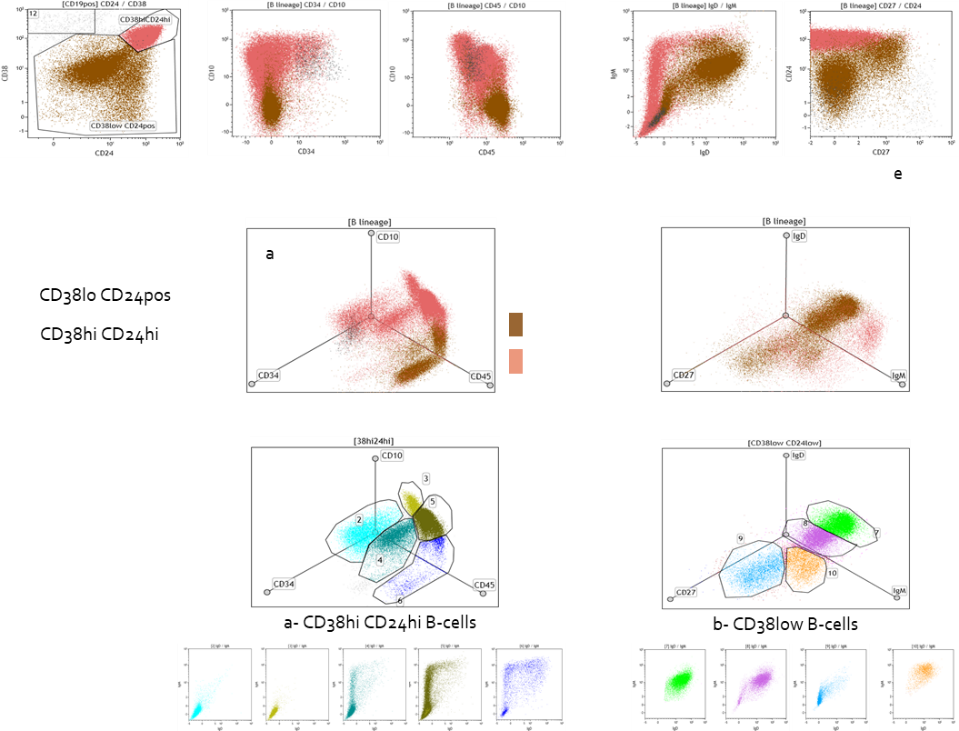
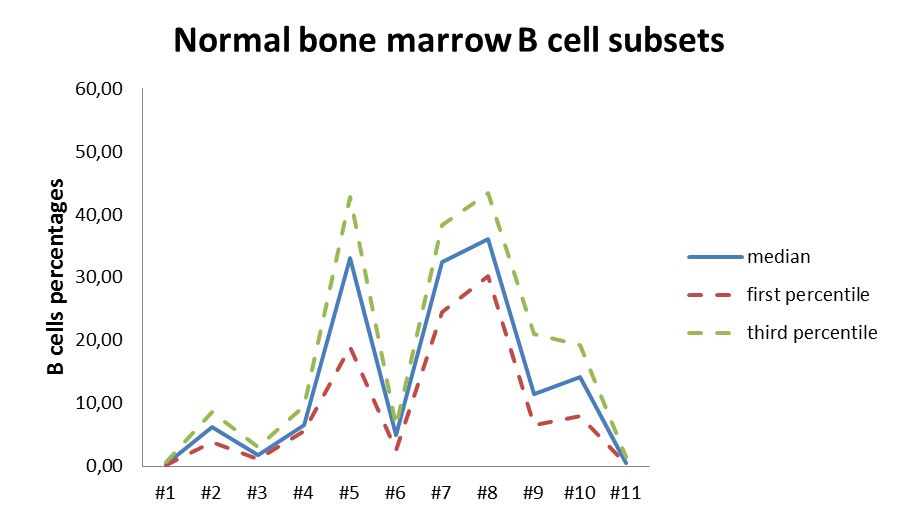
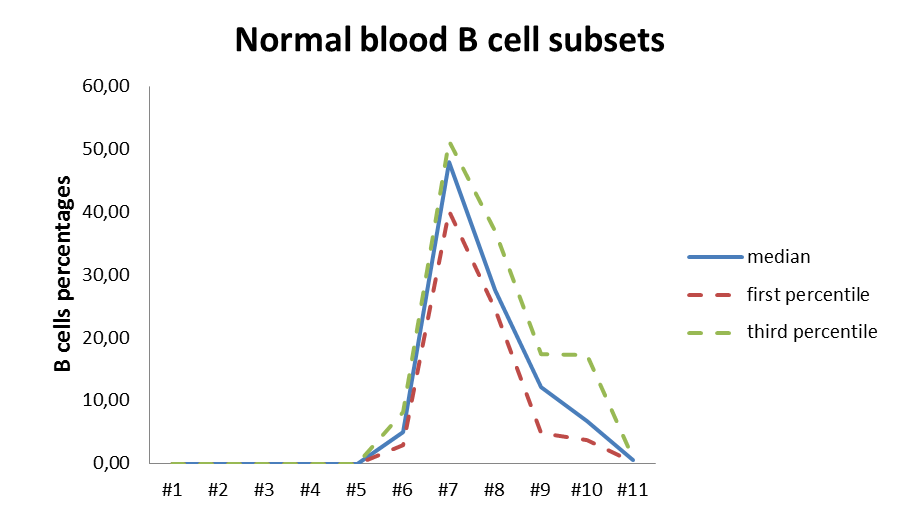
B-cells sub-populations distribution :
(a) normal human bone marrow
(b) normal circulating B cells
Fluorescence microscopy
A quantitative approach by fluorescence microscopy is widely used to study the germinal center (GC) development or the B-cell nucleic organization (using automatized acquisition mode of multiple fields on up to 8 slides, including z stacking and full cryosections acquisitions).
GC development
Immunofluorescence staining of the germinal center is used to measure the number and the area of the GC after immunization in our transgenic mice.
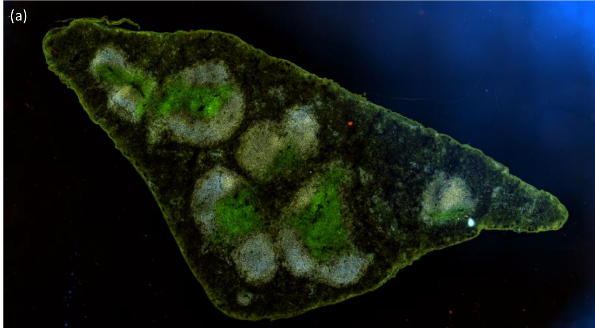
Splenic cryosections
(a) Yellow: B cells B220+ / Blue: IgD+ /Green: Gl7+
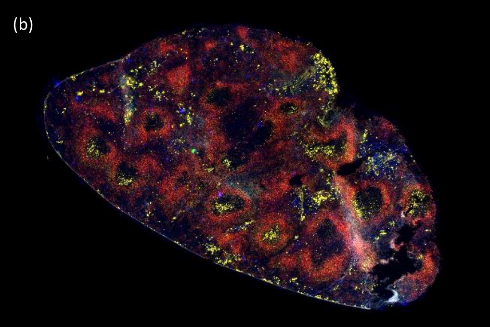
(b) Blue: IgG+/ Green: IgA+/ Red: B220+ / Yellow: IgM+
B cell nucleic organization
We have developed with Sandrine Le Noir a 3D DNA FISH technic used to explore the relationship between some specific regions of the Ig locus (as the 3’RR), the nuclear localization of this locus and the regulation of its expression.
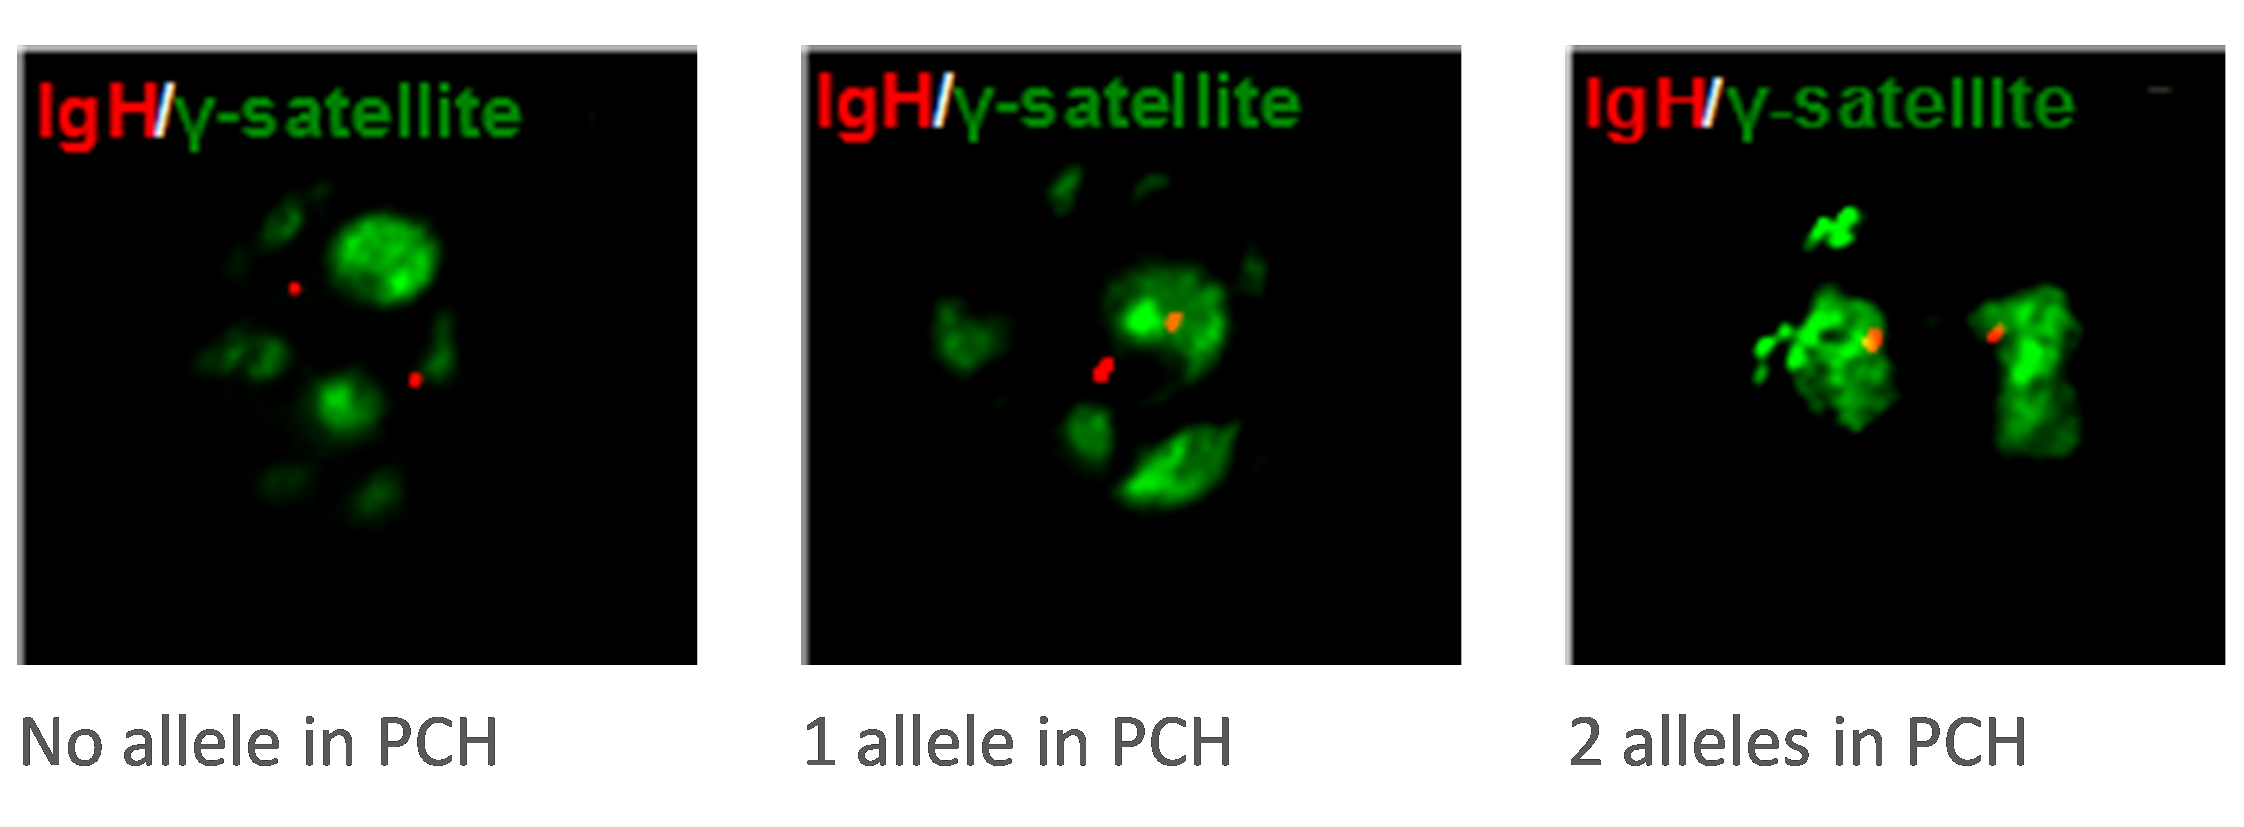
DNA 3D FISH (PCH: PeriCentromeric Heterochromatine).
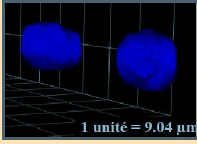
3D nuclei visualized with Volocity software after deconvolution with Huygens.