Panacée encodée
Infographies sur les médecines naturelles à la croisée des chemins entre communication, innovation et utopie Encoded Panacea: Infographics about Natural Medicines at the Crossroads between Communication, Innovation and Utopia
En se concentrant sur un corpus de 10 outils de visualisation et 40 infographies conçus pour fournir des informations sur les médecines naturelles et les remèdes indigènes, l'objectif principal de cet article est d'explorer le rôle des représentations picturales comme points de rencontre et de tension entre l'artificialité et la naturalité. Alors que ces supports numériques spécifiques sont conçues pour présenter des données sur des potentialités imaginées, parfois utopiques, de la nature, elles articulent également par inadvertance la relation paradoxale qui existe entre les imaginaires, la technologie et les idées sur l'innovation. Les infographies sont censées véhiculer des informations, mais elles peuvent également dissimuler des techniques et des tactiques qui exploitent et créent des marchés (in)existants pour des produits qui reflètent les angoisses des temps modernes. Alternativement, les infographies peuvent être conçues comme des tentatives heuristiques pour rendre visibles les communautés épistémiques sous-représentées.
By focusing on a corpus of 10 visualization tools and 40 infographics designed to provide information about natural medicines and indigenous remedies, the main aim of this paper is to explore the role of pictorial representations as encounter and tension points between artificiality and naturality. While these specific digital outputs are conceived to present data about imagined, at times utopic, potentialities of nature, inadvertently they also articulate the paradoxical relation that exists between imaginaries, technology and ideas about innovation. Infographics are expected to convey information, but they can also disguise advertisement techniques and tactics that tap into and create (un)existing markets for products that reflect modern times anxieties. Alternatively, infographics can be conceived as heuristic attempts to render visible underrepresented or silenced epistemic communities and knowledge practices overlooked by hegemonic prevalent systems.
Introduction
Easily accessible tools and readily available software to create visual representations of data, known as infographics, are having an impact on the way in which information about natural medicines and remedies is communicated across digital platforms. Visualization tools enable users to construct pictorial sources of information, endorsed by the perceptual veracity commonly attributed to explanatory diagrams and structured representations of data (Cairo, 2012). In terms of function, genre and reception, these representations commonly operate as sources and summarizations of knowledge and information (Lankow, 2012). Data-based images and texts suggest observable, empirical and verifiable methodologies have been used to obtain the information presented. In this sense, infographics have an epistemic value, and yet, as I show in this paper, they can also operate as reflections of other processes, such as the dissemination of decontextualized and unsubstantiated information. Representations of data effectively operate as building blocks to abstractly create any possible scenario, including utopic ones. Implying, for instance, that a fruit, such as goldenberry (Physalis peruviana), can effectively treat diabetes and a plant, such as cat’s claw (Uncaria tomentosa), can cure cancer are examples of statements disseminated across the internet through infographics. The creation and proliferation of this type of visualizations is attributable to the widespread appearance of computer-based tools. By proxy, infographic software interfaces indirectly enable the promotion of facts that counteract, for instance, allopathic research-based medicine. By focusing on a corpus of visualization tools and infographics, the main aim of this paper is to explore the role of these representations as encounter and tension points between the state of having a natural quality or character (naturality), and the absence thereof (artificiality) (Merriam Webster, 2021). Nature, medicines and utopia are interwoven in the human imaginary because health, or its absence or impairment, is diametrically opposite to the idea of a perfect state of wellbeing. In the context of ethnomedicines, infographics have a digital material dimension as they exhort and mobilize users to interact with tangible objects that have physical implications. In unprecedented ways, digitally produced and mobilized infographics prompt virtual platforms to allocate and accommodate content that reflects the complex relation between societies, technology and the natural world.
1. Literature Review
To a certain extent, infographics introduce reconfigurations in the dissemination of knowledge systems and practices as they adapt elements of informal epistemic repertoires into formats that can travel virtually. Information visualizations are morphologically consistent with pictorial externalizations and tabulations used by scientists to present and organize data. The similarities between formal (e.g., those used in an academic publication), and informal (e.g., those used to advertise consumables), are explained by the proliferation and democratization of interfaces. Their propagation attests to the involvement of societies, as appropriators of DIY (Do-It-Yourself) media production, debunking the notion that audiences are passive consumers of images (Jenkins, 2006). In the process, beliefs, attitudes and values easily overlooked by mediatic regimes are more likely to bypass conventional mechanisms that control the flow of information at a community-based level. Epistemic exchanges are rooted in the intangible legacy of societies. Collecting and retaining information across generations defines the formation and evolution of culture (Leroi-Gourhan, 1945) and hence, cultural affiliation becomes a matter of shared elements that define unity and distinction. A particular set of accumulated information and experiences distinguishes a community from other and results in collective tendencies. Techniques adopted by social groups always have communal implications (Simondon, 2001). Technology is a set of tangible and intangible entities materialized in artifacts conceived to serve a purpose. Whether it is a wheel, a fork or a computer, their physicality bears testament to the principles behind their production. Societies develop, live and experience technology on their own terms, according to acknowledged practices, tradition and agreement (Leroi-Gourhan, 1945). At a representational level, the juxtaposition of culture and technology prompts the creation of symbolic externalizations. Interfaces are part of systems that allow for the articulation of interaction, but also for the production of immaterial cultural objects. Function and operationalization of machinery and equipment have «collective» (Simondon, 2001, 245) aftereffects in the spaces where they are adopted. As observed by Galloway (2012), software prompts questions to which the only answer are interpretations of what is being produced. Digital artifacts have ramifications beyond the virtual realm where they emerge and circulate. By optimizing and simplifying guidelines, step-by-step instructions, and screen display configurations, modern software opens up new possibilities for the creation and accessibility of users to visualization tools (i.e., infographics) (Cairo, 2012; Lankow et al., 2012; Otten et al., 2015).
Within limits, infographics have an epistemic value and fulfil an epistemic role in the sense that knowledge transmission is their ultimate goal (Pflaeging and Stöckl, 2021). A problematic aspect of potentially unfounded health-related communication is that it does not necessarily reflect the body of existing state-of-the-art knowledge, contradicting at times established epistemic paradigms and practices (i.e., scientific method, clinical trials, etc.), and deceiving the most vulnerable social groups (Richter et al., 2009; Mena, 2021). Moreover, unregulated production of visualizations occurs at times in contraposition with official legal frameworks adopted to dictate when and how claims about medicinal properties are allowed for promotional purposes (Elvin-Lewis, 2001; Bent, 2008). This distinction overlaps with the hegemonic/non-hegemonic dyad that distinguishes centrally produced knowledge (e.g., pharmaceutical drugs development), from peripherally kept systems of knowledge (e.g., traditional medicine praxes and oral tradition). In the process, infographics become spaces that challenge epistemic paradigms (i.e., biomedicine). Unexpectedly, technological advancements derived from institutionalized approaches to knowledge production, such as computer engineering, are facilitating the visibility of commonly overlooked traditions of knowledge dissemination (e.g., oral tradition). The notion of tradition matters to understand the positionality of medicinal plants as part of attempts to maintain and reintroduce indigenous knowledge systems. In the context of increased demands to recognize the validity of overlooked epistemic systems, beyond standardized practices dictated by a universal scientific method, it is a difficult task to assess exactly to which extent infographics contribute to the expansion of half-truths and fake data. Scientific evidence supports the claims that both goldenberry (Physalis peruviana) and cat’s claw (Uncaria tomentosa) have some medicinal properties (Bors et al., 2012; Shen et al., 2018; Kasali et al., 2021; Kumagai et al., 2021), but do not conclusively suggest the natural compounds are panaceas. There is no indication either of them cures any of the ailments, conditions or diseases mentioned in the infographics.
In the context of diagrams and graphics that obviate references to external sources that support their claims, particularly in terms of validity, scientific rigour, and verifiability, the notions of pharmacological efficacy becomes porous (Goldman, 2001; Crawford and Leventis, 2005; Valerio, 2005). Conspicuously, as Martucelli (2016) observes, for contemporary societies, innovation anticipates the primacy of communication and consumption in their interaction with the effects of technology in their daily lives. Novel treatments derived purportedly from ancient epistemic systems and traditions are presumably introduced to engender imagined (often utopic) potentialities of nature (i.e., targeted curative properties). In the process, they seem to articulate the paradoxical relation that exists between imaginaries, technology and culture, specifically from an artificiality and naturality standpoint.
2. Materials and Methods
In order to delve into the role of visualizations as vehicles to communicate information about natural medicines, this paper focuses on two sets of objects of study. On one hand, I review a set of ten visualization tools/applications/software (Animaker, BeFunky, Canva, Infogram, Easel.ly, Piktochart, Snappa, Venngage, Visme, and Vizualize.me) in terms of their modus operandi as interfaces to create infographics. Selection criteria are popularity in search engines, visibility of their templates in images archives and diffusion as tools used by various types of users and for various purposes (e.g., advertisement, commerce, education, non-profits, etc.). Since users deliberately search for easy-access, easy-to-use tools, I place emphasis on the heuristic and iconic criteria that eventually explain the end product. On the other hand, a corpus of 40 infographics in English and Spanish provide qualitative data on the ways in which ethnomedicinal products and natural remedies are presented. The objects of study are specifically 20 infographics presenting information on the health benefits of goldenberry (Physalis peruviana), and 20 on the medicinal properties of cat’s claw (Uncaria tomentosa) (See Figure 1. and Figure 2.). The plant and fruit were chosen based on the diversity of applications attributed to them, diffusion of infographics on their therapeutical qualities, existence of empirical research on their pharmacological effectivity, controversies across formal and informal settings about their health-enhancing properties, and documented history as endemic plants to territories originally inhabited by indigenous populations of Mesoamerica, but widely available outside the region, particularly in North America and Western Europe.
Figure 1: Goldenberry (Physalis peruviana)

Petra Fischer, Pixabay. Creative Commons license.
Figure 2: Cat’s claw (Uncaria tomentosa)
Kristi Denby, Archivo Centro Takiwasi, Takiwasi Centre, Tarapoto, Peru. CC license.
Methodologically, I use discourse analysis of the textual components of the infographics and software in combination with a semiotic analysis of their pictorial composition. The choice of methods is based on the ontological and epistemological character of infographics and visualization tools, as constructions, artifacts, sources and structures of content that co-disseminate, or claim to diffuse knowledge, factual information and corroborated data. Discourse analysis provides a well-defined framework embedded in specific tools. As a method, it provides guidelines to identify patterns across texts and contexts in which they circulate (Paltridge, 2006). It also allows to examine systematically how textual practices deploy meaning, favour perspectives and use language persuasively to draw attention to specific themes. As for images, semiotic investigation of the ideological, discursive and symbolic character of pictorial construction techniques and templates affords deeper understandings of visualizations created to circulate outside regulated epistemic systems (e.g., academic publications). An examination of infographics needs to take into consideration that « visualization of data must invent an artificial set of translation rules that convert abstract number to semiotic sign » (Galloway, 2012, 83). It is therefore critical to use tools to decipher the symbolic aspects of the objects of study. As a methodological approach, semiology offers structured techniques to identify, interpret and analyse signs in infographics and visualization software.
3. Analysis
The discourse analysis of the 40 infographics involved the identification of 7 lexical clusters, divided cross-referentially according to their pragmatic and semantic functionality. Within the first category, I identified referential and conative verbs in 36 infographics. Examples include, third person neutral present tense form of verbs distinguishable for making references to actions with positive (1), neutral (2) or negative connotations (3): to increase, to enhance, to improve (1); to balance, to prevent (2); to decrease, to reduce, to treat, to repair, to eliminate (3). Semantically, the 5 lexical fields identified contain clusters related to the health-enhancing benefits of goldenberry (Physalis peruviana) and cat’s claw (Uncaria tomentosa): medicinal properties (e.g., anti-inflammatory, antiviral, anti-cancerogenic, anti-oxidant, analgesic), names of diseases and conditions, symptoms of conditions (e.g., rheumatism, diabetes, cancer, rheumatoid arthritis, damaged DNA, herpes virus, age-related memory impairment, sun-damaged skin, oral bacteria, joint and back pain, osteoarthritis, gastric ulcers, infections, Crohn’s disease), therapeutical and nutritional content-related terms (e.g., calories, vitamins, minerals, active ingredients, enzymes, alkaloids, glycosides) and references to indigenous epistemic systems (e.g., indigenous medicine, Amazon tribes, century-old remedy, traditional). In 32 infographics, the main theme is either goldenberry (Physalis peruviana) or cat’s claw (Uncaria tomentosa) as raw material, and the identified rhemes are the formats in which this plant and fruit are available (i.e., raw state, infusion, capsules, pills, powder, tinctures and liquid extracts). In 8 infographics, the main theme are the benefits of the natural compounds according to the different systems of the body (e.g., digestive system, nervous system, urinary system, reproductive system, respiratory system, skeletal system, muscular system and lymphatic system) and the identified rhemes are the eventual scenarios (e.g., better digestion, relaxed attitude, more energy, improved skin).
In terms of lexical cohesion, there are 56 instances of repetition (e.g., same medicinal property mentioned with a different name), 34 examples of synonymy (e.g., related health conditions mentioned in different parts of the same infographic), and 152 distinct meronymy patterns (e.g., organs as part of systems or symptoms as signals of specific diseases). As for mechanisms to express engagement, as identified by Paltridge (2006), attribution and presence of proclaimers are present in all the infographics (40). Logically, the main attributional technique is endorsement of the natural remedies. This is done through exhortative descriptions and narrative statements (e.g., « this fruit feeds you and cures you », « even if you don’t believe it »). In terms of literal content, infographics frame goldenberry (Physalis peruviana) and cat’s claw (Uncaria tomentosa) as novelties or rediscovered knowledge. The language used implies that the graphics seek to alert readers about the benefits of ethnobotanical approaches and expand dominant repertoires of therapeutical options. In total, 26 infographics use references to traditional medicine as sources of knowledge.
Through the semiotic analysis of infographics, it was possible to identify repetition of certain shapes (i.e., squares, circles), connectors (i.e., arrows and vectors) and symbols (i.e., ideograms, typograms, pictograms and icons). Cases of similarity include the use of right-angled shapes in the text banners. Out of 40 infographics, 31 follow a system of visual hierarchy for titles, subtitles and important information panels. Opposition is mainly identified in terms of contrasting colours. All 20 infographics about cat’s claw (Uncaria tomentosa) include two or more hues of green and all 20 infographics about gooseberry (Physalis peruviana) use at least one hue of orange. Images of the raw fruit and plant occupy the centre or upper middle position of the visualizations. Accumulation is present in 36 infographics, predominantly conveyed through images of fruit, bark and leaves cuttings in raw state. Alternatively, accumulation is used through the scattered presence of capsules or pills containing the natural compound in question (See example, Figure 3.). In terms of syntagms as defined by Ablali and Ducard (2009), the organization in the 30 infographics indicate the therapeutical (either medicinal or nutritional) value are the key message. Through the use of capital letters, boldened fonts and compartmentalization of the space, the less prominent areas are reserved to practicalities (e.g., contraindications).
Figure 3: Goldenberry Nutritional and Medicinal Benefits Infographic
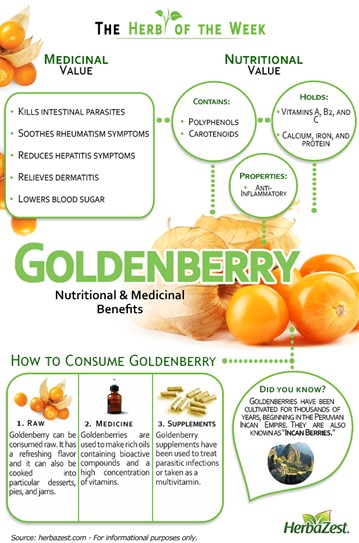
HerbaZest, Pininterest. Fair use.
The producers of the infographics include private companies specialized in exporting/importing fruits and plants categorically advertised as exotic and tropical (15), NGOs employees stations in the countries growing goldenberry (Physalis peruviana) and cat’s claw (Uncaria tomentosa) (8), middle-size and small natural food chains (7), businesses and individuals from the fitness-related industry (e.g., trainers, sport nutritionists, marketing agents) (5), bloggers and vloggers interested in promoting healthy lifestyles (4) and one hospital. Inadvertently, the content convincingly organized in these diagrams and graphics (e.g., photos of seeds and capsules), according to each content producer/user, appears to present similar information or comparable claims. Authors seem to use other infographics containing unsupported information as main source. The structural design of images and accompanying texts make them ideal to be shared across information environments visually and linguistically. In this way, labelling systems that commonly underpin findability based on algorithms that map input to output, produce categorizations where research-based and non-research-based infographics are presented as equivalent sources of information. Superlative descriptions of efficacy and therapeutical benefits (e.g. anticancerogenic properties), many bordering utopic descriptions, are in fact more readily accessible to mainstream audiences than graphic or diagrams used in academic publications, among other reasons, because they lie behind a paywall, or are not uploaded directly into open access platforms.
Visualization interfaces differ as much as the infographics that result from the various sets of templates they offer. With the advent and development of digital tools available across the internet, at present, any user is able to create professional looking visualizations. Templates operate as pre-determined layouts and styles that accommodate any type of data entered by potential authors. These prototypes are developed to assist users to create visual and textual hierarchies, organize content and compartmentalize the space devoted to additional iconographic elements. Series of tutorials, brief explanatory videos, detailed instructional material and examples furthermore facilitate the creation of graphic displays of information. In general, there are some intrinsic and extrinsic commonalities shared by interfaces and pictorial representations of information. One of them is the primacy of time as a quantitative measurement of the maximization of output (e.g., quality of the infographic) in relation to the amount of input needed (i.e., number of steps to complete one). Client-friendly design customizations are presented in terms of the advantages and affordances of using templates that can be transformed into infographics within minutes, and that target audiences can read quickly. For this purpose, toolkits, embedded libraries of images, preinstalled menu of icons and options to import data are in place to enable users to tailor and modify the configurable templates at will. Emphasis on time does not necessarily imply the messages are not carefully curated by authors, but it is indexical of the popularization of content production with informative purposes. Another intrinsic aspect worth mentioning are the categorizations used to distinguish between free and paid options. Some tools, such as Infogram, enables systems to track engagement and in-depth metrics, while complex sets of data that could increase the robustness of the information are embeddable in exchange for a fee.
Extrinsically, even if the combinations seem endless, unless users choose an empty canvas, templates are reconfigured to privilege images and icons over long pieces of texts. Special areas are reserved for the information considered to matter the most, and icons, enhanced through editable sizes and colours, are encouraged for the core of the message/argument that the infographic intends to convey. Users can make use of heuristic techniques such as visibility techniques, and recognition and readability shortcuts.
4. Discussion
The specificities of how infographics present and promote goldenberry (Physalis peruviana) and cat’s claw (Uncaria tomentosa) as remedies exemplify how interfaces operate as sites of knowledge production within interconnected epistemic systems (i.e., through the internet). By extension, they offer a reflection on the relation between societies, technology and health, and how they are traversed by the interplay between nature and technology. Here are four aspects to consider.
Firstly, visualizations are used to frame and contextualize innovation. Novel iconic approaches become examples of additions to dominant existing systems of knowledge by implying that the treatment and care of the body are not property of mainstream, allopathic, research-based bio-medicine. A case in point are consumables and remedies adopted from traditional and indigenous ethnobotanical practices, and which are positioned either in contrast, or in addition to, or as replacement of, or as alternatives to conventional pharmaceutical treatments, perceived as extensions of hegemonic mass-production profit-driven attempts to capitalize human health. These visualizations have the potential to represent epistemic communities that might not necessarily be involved in their production at any stage. Some might be negatively impacted by the information presented in the infographics, or the economic enterprises behind them (i.e., overconsumption of plants growing in fragile ecosystems).
Secondly, externalizations of knowledge systems extrapolate and dislocate authoritativeness of centralized communication of knowledge. Self-appointed producers of epistemic artifacts, endow their outputs with their own understandings, expectations, sensitivities and anxieties. Whereas legal constraints regulate pharmaceutical companies, requiring them to observe well-defined safety standards and procedures, artisanal health-enhancing consumables are exempt from regulatory provisions, or are minimally monitored or policed. Often, medicinal consumables are legally categorized as food products and hence, remain outside the legal framework that applies to medicines (Crawford and Leventis, 2005). Yet, within digital spaces, and often through visualizations such as infographics, cat’s claw (Uncaria tomentosa), for instance, is promoted to treat bowel cancer, mental depression, diabetes and Crohn’s disease. This special position allows for unsubstantiated informational material to navigate through search engines, permeating and bypassing any control or verification of their content.
Thirdly, as a strategy, (a)historicity claims add to the (a)technological dimension of health-enhancing consumables, but also to their validity. Allusions to antique civilizations (i.e., Aztecs), extinct empires or states (i.e., Incas) or unidentified ethnic groups contextualize the background of the information mentioned in the infographics. This echoes a long-established convention in visual culture. Characterizations of indigenous societies commonly render them as wise noble savages closely related to nature (Gonzalez Rodriguez, 2022a) and as practisers of riskless medicinal and therapeutical treatments that involve herbal drugs (Gonzalez Rodriguez, 2022b). Instead of empirical evidence or sources supported, for instance by clinical trials, natural remedies information visualizations suggest vaguely explained connections between tradition, rediscovered practices and ancient epistemic systems are enough evidence. A common denominator is the notion that age-old practices are less artificial and more natural than current ones, or that they are in either case not linked to artificial or industrial processes. Whereas pharmaceuticals are presented as embodiments of technology and artificiality, plant-based remedies are depicted as tangible extractions of a natural state (naturality). The tension between the materiality of objects as derivatives of living organisms or machines is central in many visualizations. Exhortations to consumers to choose natural products is furthermore advanced through references to the current environmental and sanitary crises. Infographics imply they present pieces of knowledge from time immemorial and describe them as innovative additions to existing healing practices. Since infographics will probably keep travelling across media platforms, in various formats and contexts, for years to come, they risk becoming prominent sources of information.
Fourthly, infographics assertively attest to the propagation, replicability and individualization that has eclipsed uniform, gatekept, institutionalized representations of information. Societies as creators of content with epistemic value and as audiences/consumers thereof displace, or at least, reposition the self-referentiality of academic knowledge, science and technology. Virtually conceived representations become in fact objects that challenge preconceptions about artificiality (their own source) and the realm circumscribed by the non-natural. A machine-derived practice, ritualistic to some degree, such as producing a pictorial representation and sharing it online, discursively and ideologically instigates reflections about nature and its healing properties.
Conclusion
Users of visualization software are deploying easy-to-use tools to construct informational material about natural medicines and disseminating them through virtual platforms. In most cases, they are linked to commercial endeavours, but also from a need to educate the public interested in alternative healing treatments, or complementary health-enhancing practices. The architecture, structure and integration of images and texts in visualizations mirror the diversity of templates outlined by visualization software parameters. Embedding and interconnecting techniques are crucial to enhance retrievability and findability of the knowledge presented in the visualizations. Both natural and artificial changes have an impact on how new elements enter a culture (Leroi-Gourhan, 1945). Illustrative formats of portraying data benefit from the fact that images convey messages quicker than texts. Innovation in software and digital tools seem to respond to recent developments in terms of internet users’ short attention span and universality of social media content production. Platforms such as Facebook, Instagram, LinkedIn, Pinterest and Twitter, allow for the inception, insertion and inclusion of infographics, and hereby, they become co-participants in the circulation of unverified knowledge. Hereby, even if that is not their ultimate goal, visualization software companies become indirectly co-facilitators of the diffusion of uncorroborated sources of information. Nature as a panacea is encoded in the somehow utopic assertions mobilized by infographics, and materialized through the consumables and remedies portrayed visually and mobilized virtually. Circulating content as information conceals its provenance and validity. By the same token, visualization tools can potentially secure the production of representations that include and expand the recognition of peripheral systems of knowledge (i.e., oral traditions), and alternative epistemic artifacts and practices (i.e., treating diseases), often overlooked by mainstream scientific output structures. Somehow, this seems to mark the onset of an epistemic communicational turn in which imaginaries, attitudes and the place of naturality and artificiality within knowledge systems are expressed and negotiated through graphics.