Investigating (in)coherence in Tyneside English(es): sociophonetic variation spectrums of face, goat, price and mouth in the DECTE corpus Analyse sociophonétique de la cohérence en anglais de Tyneside : les continuums variationnels de face, goat, price et mouth dans le corpus DECTE
The present study investigates the co-occurrence of face, goat, price and mouth vocalic variants in the Tyneside Linguistic Survey (TLS, Strang, 1968). The analysis is based on the original fine-grained transcriptions of the TLS sociolinguistic interviews across a sample of 44 predominantly working-class speakers (men/women, older, middle-aged and teenagers). Multiple Factorial Analysis and cluster analysis were combined to identify sub-groupings in the variety based on the entirety of the transcriptions (consonants, stressed and reduced vowels), and to investigate coherence across these vocalic variants. The results point towards major gender and class effects with four clusters of speakers characterised by varying degrees of accentedness. Overall, lower-status women and slightly higher-status women distinguish themselves through distinct variant choices. Differences amongst men of either status can best be measured through the extent to which they use the traditional variants.
Cette étude propose une analyse de la co-occurrence des variantes phonétiques des ensembles lexicaux face, goat, price et mouth (Wells, 1982) dans l’Enquête Linguistique de Tyneside (TLS, Strang, 1968). Les transcriptions phonétiques d’origine effectuées sur les dix premières minutes des entretiens sociolinguistiques servent de base à l’analyse, sur un échantillonnage de 44 locuteurs issus de milieux modestes (hommes/femmes, trois classes d’âge). Une analyse factorielle multiple (AFM, Escofier, 1985) suivie d’une classification a permis de classer les locuteurs en sous-groupes en fonction d’une utilisation plus ou moins marquée de l’anglais de Tyneside et d’analyser la cohérence des schémas variationels de ces groupes de locuteurs. L’intégralité du système phonologique disponible à travers les transcriptions a été pris en compte dans l’analyse. Les résultats indiquent que le milieu social ainsi que le genre sont des éléments déterminants dans la classification des locuteurs. Les femmes au statut social légèrement différent se distinguent par un choix plus systématique de variantes vocaliques. La distinction entre les hommes se mesure plutôt à travers la fréquence d’utilisation des variantes traditionnellement associées à l’accent de Tyneside.
Introduction
1Tyneside English, henceforth TE, is a variety of English spoken in the north-east of England. The data reported here was collected from the Tyneside Linguistic Survey (Strang, 1968; Strang and Pellowe, 1969). It comprises a series of recorded one-on-one sociolinguistic interviews carried out in the two urban areas of Newcastle and Gateshead (Figure 1), the reading of a wordlist, and acceptability judgements (Allen et al., 2007). Recordings were carried out in the late 1960s and early 1970s. One of the TLS’s characteristics is that a portion of the interview material is matched with fine-grained phonetic transcriptions (Beal et al., 2014). A sample of these transcriptions from the recorded sociolinguistic interviews of 44 out of 88 speakers from Gateshead and Newcastle is analysed in this paper–the remaining recordings and their matched phonetic transcriptions were not yet available at the time of the study.
Figure 1: map of Tyne and Wear, north-east England
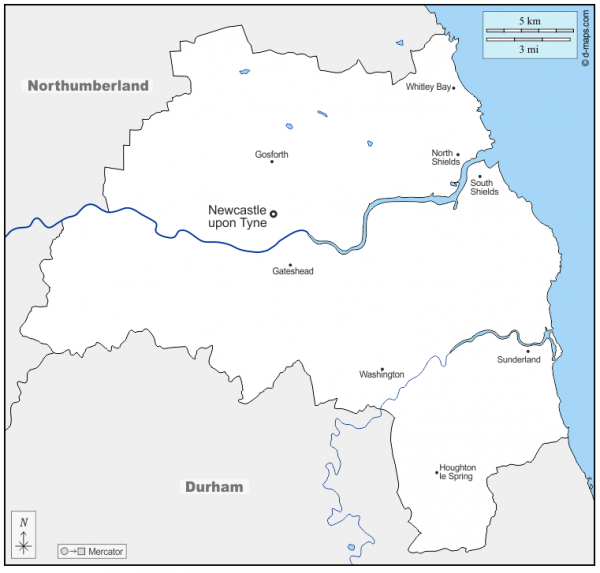
Source: https://d-maps.com/carte.php?num_car=112548&lang=en
2While most studies analysed one linguistic feature at a time (Trudgill, 1972), the TLS pioneered in opting for aggregate (Nerbonne & Wieling, 2017) approaches in language variation and change (Pellowe et al., 1972), i.e. the investigation of the relationships among multiple linguistic variables. Nevertheless, the two approaches should not necessarily exclude each other, as Corrigan and colleagues highlight the complementary role of feature-based and aggregate approaches (Corrigan et al., 2014) in revealing various aspects of co-variation in TE. This paper is a compromise between the two approaches: an aggregate statistical analysis is performed on highly enregistered (Agha, 2003) Tyneside vowel variants of face, goat, price and mouth. Jones-Sargent (1983b) performed the first analysis on the fine-grained phonetic transcriptions of the TLS but was faced with the difficulty of a full aggregate analysis due to the computational limitations of statistical programs at the time. Moisl & Maguire (2008) analysed a less fine-grained level of transcription but flaws in the original hierarchical structure of the transcription coding itself led to a major bias amongst certain consonantal features, thereby potentially assigning greater weight to the vowels. The two studies, nonetheless, provided fundamental suggestions for future research: (1) reducing variational noise in the data, i.e. allotting less statistical importance to minor variation patterns, and (2) looking at how stable the clusters across various clustering approaches are. These two approaches were carried out by Moisl (2015) in a later study but with the same semi-fine-grained transcriptions. The present paper draws on the methodological approaches of the two studies: firstly, the use of the fine-grained transcriptions to limit biases caused by the hierarchical structure of consonantal features and secondly, that of noise reduction tools prior to classifying the speakers (cf. methodology section).
- Note de bas de page 1 :
-
Dimensions are also known as factors in a factorial analysis, or principal components in a principal component analysis.
3However, the innovative methodological aspect of this paper is the application of Multiple Factorial Analysis or MFA (Escofier & Pagès, 1984) to language variation, a tool generally used in sensorimetry (Husson et al., 2001) or in the study of ecosystems (e.g. Lamentowicz et al., 2010). MFA takes into account the hierarchical structure of variational data, namely, the link between a vowel and the variants pertaining to that vowel. It also reveals how linguistic variants covary. Namely, if a speaker uses a regional vowel variant for goat, do they use regional variants for the other three vowels? In addition, MFA summarises variation into trends through dimensions (ranging from broad to subtle)1, without obliterating individual variation.
4MFA cannot draw boundaries between individuals to form sociolinguistic groups, which is often relevant in language variation. However, when coupled with clustering analyses (Husson et al., 2010), groups with similar variation patterns can emerge. The combined approaches are therefore particularly suited for sociolinguistic research.
- Note de bas de page 2 :
-
The local football club.
5Following British sociophonetic conventions for the description of English varieties, the standard keywords face, goat, price and mouth, proposed by Wells (1982, p. xviii-xix), are used to represent the lexical sets containing the four closing diphthongs with the following British Received Pronunciation citation form /eɪ/, /əʊ/, /aɪ/ and /aʊ/. In Tyneside English (TE), words from the price set often alternate between a raised onset [eɪ] and a low onset [aɪ]. This alternation is partially conditioned by what follows the vowel (Milroy, 1996). Milroy’s analysis revealed that working-class speakers favoured a raised onset [eɪ] in price and that younger male speakers appeared to lead the swing towards a less socially restricted use of this raised variant (Milroy, 1996). Monophthongal realisations for mouth [uː] are highly enregistered in Tyneside (Beal, 2004)–i.e. the general public is aware that this vowel is typical of Tyneside. But for most speakers, it is often used for a limited number of words like town or brown, respectively spelt toon (the Toon Army)2 and broon (Westmorland Broon ale), to reflect the local pronunciation. Beal (2004) states that the most widespread realisations of mouth in Tyneside are closer to [ɛʊ].
6face and goat are, to some degree, partner vowels working in lockstep since “the ways in which they vary in terms of their phonetic exponency and the distribution of these variants across the TE-speaking population seem to work in parallel” (Watt & Foulkes, 2017, p. 157). The most commonly used variants are [eː] and [oː] for face and goat, respectively (Watt, 1998). They are said to be unmarked in the area because they “accommodate a less marked identity as Northerners” (Haddican et al., 2013). They will be referred to as the pan-northern variants (Ibid.). The local variants are often realised as forms approximating [ɪə] for face and [ʊə] or [ɵː] for goat (Corrigan, 2012). Closing diphthongs [eɪ] and [oʊ] are often heard among middle-class speakers (Watt & Foulkes, 2017) and will be call prestige-variants. Given the asymmetry across the variant inventories for each vowel and the social indexicality observed in more recent TE speech (Watt, 1999; Milroy, 1996), the working hypothesis of this paper is that coherence in TE is only partially the result of linguistic constraints such as the Scottish Vowel Length Rule (Milroy, 1996) or the type of phonemes on either side of face and goat vowels (Buchstaller et al., 2017) and that social factors, first and foremost, play a major role in accounting for correlation in usage–as found in many sociolinguistic studies on other varieties (starting from Labov, 1972; Macaulay 1977 and Trudgill 1974). However, studies investigating co-variance (coherence) in a variety are rarer (cf. Guy, 2013; Beaman & Guy, 2022). This was also amongst the original aims of the Tyneside Linguistic Survey (Jones-Sargent, 1983, p. 21-22). Following De Camp’s study in 1971 on Jamaican English, more recent approaches have delved into the blurry boundaries of sociolinguistic stratification, thereby looking at continuums instead of discrete groups (e.g. Amand, 2019 on TE, Sewell, 2022 on Hong Kong English consonants).
7The purpose of this paper is to report intercorrelations of four highly enregistered (Agha, 2003) TE vowel variants, i.e. those of face, goat, price and mouth based on the original TLS phonetic transcriptions. The following questions are raised: (1) Lects: how many linguistic groups can be found through the variant choice of face, goat, price and mouth only? (2) Coherence: do these groups use variants consistently across face, goat, price and mouth in TE? (3) To what extent are the lects, and the coherence within, socially motivated? (4) Can variation patterns be defined less in terms of discrete lects, but rather in terms of multiple variational spectrums?
1. Methodology: the corpus
1.1. The TLS phonetic transcription scheme
- Note de bas de page 3 :
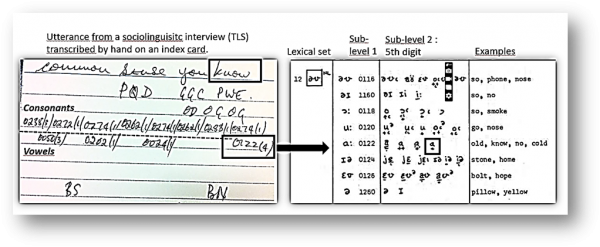
8The data analysed in this paper is referred to as the TLS-coding data. It is composed of fine-grained phonetic transcriptions (carried out by trained phoneticians) of the first ten minutes of recorded sociolinguistic interviews. The recordings were made in the participants’ homes. These transcriptions comprise consonants, stressed and reduced vowels. To make the transcriptions computer readable, each phonetic variant deemed likely to appear in speech was encoded as a sequence of five digits (Jones-Sargent, 1983, p. 295-302), incorporating a two-level hierarchical structure (Figure 2). The full coding-scheme is available on the DECTE website (Jones-Sargent, 1983a)3.
Figure 2: original transcription cards (left) & TLS coding-scheme (right)
1.2. Phonetic data
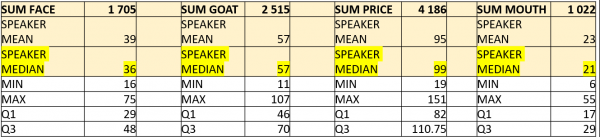
9The sample of the TLS-coding data analysed is composed of frequencies of 566 variant types distributed across all 63 phonetic features (consonants and vowels) during the first 10 minutes of a sociolinguistic interview for 44 speakers. The number of variant types across the 4 vowels amounts to 84. The total number of transcribed variants amounts to 105,204 tokens, 9,428 of which pertain to the face, goat, price and mouth lexical sets. The median number of occurrences per speaker for the latter four features ranges between 21 and 57. Frequencies were computed from raw counts of all variants within each lexical set.
Table 1: counts per speaker per vowel (total count: top row, speakers: n= 44).
1.3. Selected social data
10The original aim of the TLS was to include as many social variables as possible–father’s occupation, parents’ birthplace, political affiliation, leisure, identification with the area, and so on, in order to build a hierarchy of the social characteristics that were more significantly linked to the linguistic variational patterns (Jones-Sargent, 1983). In the present study, we chose to retain macrosociological categories (Eckert, 2012) such as age, gender and social class. A fourth category regarding whether speakers had continued their education after the minimum school leaving age was also included.
1.4. Participants
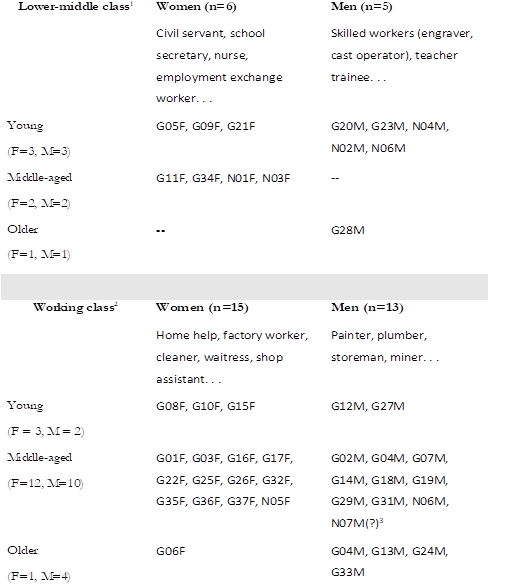
11We selected the 7 Newcastle and 37 Gateshead participants from the original TLS study (see Table 1) whose data had been checked by the DECTE team, and made available on the DECTE website as of 2014. Since these speakers were randomly selected from the Electoral Register of 1966 by the “rateable value per dwelling by polling district” (Pellowe et al., 1972, p. 23-24), the number of participants within each macrosociological category, i.e. age, gender and class, is not necessarily even across all categories. The class categories are based upon the speaker’s (former) occupation. The Classification of Occupations of 1966 served as a reference to better fit with the social categories defined by the original TLS team in the 1960s-70s.
Table 2: Social background of the 44 TLS informants
12Middle-aged speakers predominate. We therefore expect a certain degree of retrenchment (Chambers, 2003, p. 195; Wagner, 2012, p. 375) from the use of more local or less-standard features used in youth. Two speakers were not born in the North-East (G31M: Northern Ireland, N06M: south-east London) but were included in previous studies (Moisl, 2015; Jones-Sargent, 1983b). In our study, these outliers serve as points of reference in the statistical analysis to highlight the distance between native Tynesiders and speakers who have settled in the area but were not born and raised in the North-East. They contribute to building a limit in the variational space computed by the statistical analysis, whose first aim is to simplify complex data and show macro-groupings of individuals (native Tynesiders vs. non-native Tynesiders) before going into meso-groupings within the native Tynesiders, e.g. broad vs. less broad.
13The next section details the statistical methods applied to the corpus.
2. Methodology: statistical analysis
2.1. Multiple Factorial Analysis + clustering in language variation
14The statistical tool used here to analyse the data is rarely used in sociophonetics. The methodology of the approach along with the interpretation of the results will therefore be detailed in greater length than is commonly found in articles on language variation.
- Note de bas de page 4 :
-
The term feature is used here because the approach is not restricted to phonetic variation and can be applied to other types of variation (lexical, grammatical etc.).
15A Multiple Factorial Analysis was carried out with the R package {FactoMineR} (Lê et al., 2008). It was selected over other statistical methods because it is feature-centric (Amand, 2019). Namely, each variant (or exponent) is not treated statistically as an independent variable but as a variable that is hierarchically linked to its pertaining phoneme or feature4. Hence, the results are first apprehended from the perspective of the feature itself, e.g., how variation in face helps define speakers socially.
16Unlike more common methods such as Principal Component Analysis (PCA), MFA considers the structural relationship between the linguistic features and their variants. Since there are over 20 different variants reported for face and goat (see Amand, 2019), a variant-centric approach with PCA would have generated output that is difficult to interpret because each variant is treated as an independent variable and not as pertaining to a lexical set. The approach is similar to the one used in Ghyselen and De Vogelare (2018) who computed speaker-profiles based on correspondence analysis, which also allows for sublevels of a main variable.
17Another reason for using MFA is that it gives less frequent vowels like square (RP /eǝ/) or vowels with more complex variation “a chance to have the same importance in the final analysis” (Picardi et al., 2020) as it balances out the role of each lexical set in accounting for variation. In a canonical PCA analysis, features with binary variation such as -ing (velar /ŋ/ or apical /n/) will appear as overly important in the sociolinguistic discrimination of speakers. Namely, the easier it is to split speakers (those who favour /ŋ/ vs. /n/), the more salient the lexical set will appear in the analysis. The other features, with more complex variation, will be minimised (Escofier & Pagès, 1994). Since the number of reported variants are not the same across the four vowels under scrutiny, MFA was deemed a more suitable approach than PCA.
18A cluster analysis was then performed based on the MFA output. This provides an ideal combination: (1) MFA prunes variational noise (i.e. a variant which occurs only once across two speakers) without downplaying the role of relevant variation patterns, and (2) the cluster analysis builds on the MFA analysis to identify more stable sub-groups of speakers (Husson et al., 2010). The Ward method, often also called the ‘minimum variance method,’ was used for clustering since it has proven relevant for the TLS data analysis (Moisl, 2015) and in several other linguistic studies (Deumert, 1999; Gries, 2009). It also minimises intra-cluster variance (Janssens et al., 2008; Gries, 2009) so as to limit the number of groups containing one or two speakers (see Amand, 2019 for a comparison of clustering methods on the full TLS data). Finally, I evaluated whether these groups shared social characteristics using chi-square tests provided by {FactoMineR}.
2.2. Preliminary analyses: assessing the robustness of the MFA results
19Preliminary analyses confirmed the lack of randomness in the data (Husson et al. 2011, p. 229) in variation and the need to favour MFA over other methods like PCA (see Amand, 2019, p. 345 ff.). The MFA analysis was first performed on the dataset with all 566 phonetic variants from the 63 phonological features (consonants, full vowels and reduced vowels), so as to check whether the variants of face, goat, price and mouth have comparable discriminating roles within the context of the original 63 phonological features retained in the TLS coding-scheme (see Amand, 2019, p. 355).
- Note de bas de page 5 :
-
In the “French School of PCA” (Holmes, 2006), factors are more generally called dimensions.
20In MFA, factors, aka. dimensions5, have to be viewed in terms of axes with opposite variational patterns at each end. Another element to consider is the presence of diverging variant usage, with specific variants emerging as representative of opposite variant usage. These variants play a major role because they define the limits of the variation spectrum which corresponds to a dimension. The first five variables that contribute the most to the definition of the first two dimensions percentagewise are examined. The higher the score, the better the variants help define opposite trends between speakers. Given the high number of variables included in the model, these percentages are necessarily low. But if the 84 variants had contributed to the dimensions evenly, the percentage would have been 1.19%, i.e. 84/100, while the top contributions are between three to eight times as high. Contributions were deemed reliable enough.
21Another rule of thumb is to check whether eigenvalues are superior to 1. Here, eigenvalues drop below 1 from the sixth dimension onwards, (cf. Baayen, 2008) and the first six dimensions have eigenvalues ideally superior to 1 (Di Franco & Marradi, 2013), which means that the first five dimensions are relevant in measuring variation across the sample of speakers. The remaining ones are potentially noise or marginal variation patterns. However, only the two dimensions, with respective eigenvalues of 2.81 and 1.86, will be used to plot the clusters on the factor map, since visualising six dimensions simultaneously leads to a reduced comprehensibility of the results (Ghyselen & De Vogelaer, 2018). After an inspection of the clustering output results, a maximum of nine groups was retained for the classification process because a lower number of groupings would have ironed out sub-groups using rarer variants.
3. Results
3.1. An overview of the main variation patterns
22Aggregate percentages (Figure 3) provide a general overview of dominant forms in Tyneside in the 1970s in the given sample of 44 speakers. In face and goat, the pan-northern monophthongal realisations in yellow predominate (face: 59%+2%=61%, goat: 44%+7%+3%=54%). Prestige forms with closing diphthongs (in blue) have similar scores (respectively 10%+3%+2%=15% vs. 16%+2%=18%), so do localised variants (17% vs. 21%). goat and mouth have a wider range of localised variants (green) with various monophthongal and diphthongal variants. The highly enregistered monophthong for mouth (as in Toon) is indeed extremely rare in casual interview speech (7%).
Figure 3: percentage frequency per variant per vowel for all 44 speakers
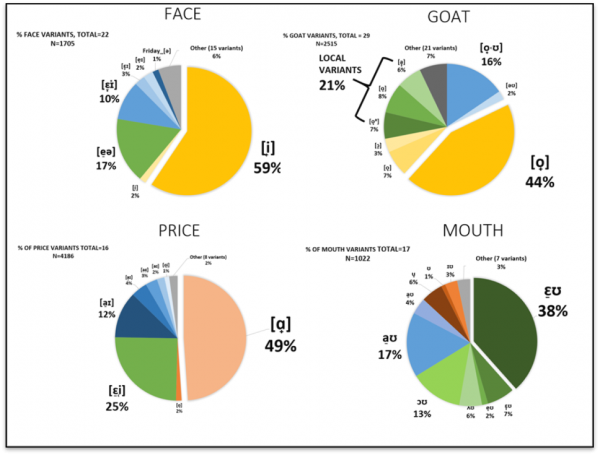
2328 speakers use the pan-northern variant [eː] for face over half the time, but only 20 use [oː] for goat above 54% of the time, this means other variants compete with the pan-northern one. 17 speakers use the raised onset [ɛʊ] in mouth above 50% of the time. Scores for the raised onset [ɛɪ] in price are lower due to the inclusion of the personal pronoun I, often realised as [ɑː] (Moisl & Maguire, 2008) but 20 speakers use the raised onset around three times as much as the low onset.
3.2. “Are yi broad?”: speakers at opposite ends of 2 variation spectrums
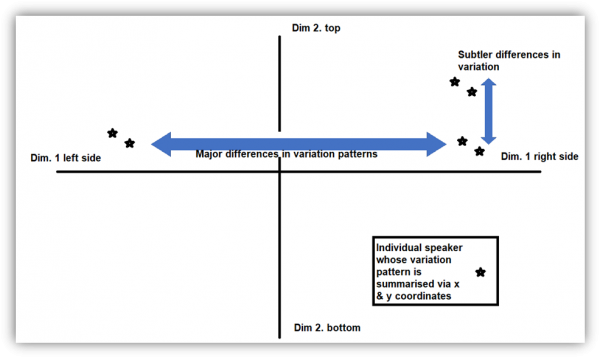
24Interpreting the dimensions: here, dimensions reflect spectrums where speakers are placed depending on their overall use of variants across the 4 vowels. Interpretation can be made easier through a plot with two axes crossing at a 90-degree angle (Figure 4). Speakers with completely different variation patterns are placed at opposite ends of that spectrum. Dimension 1 generally displays speakers on an obvious opposition: those who use non-local vs. those who use local forms. Dimension 2 shows a slightly subtler pattern opposing speakers at either end. Namely, amongst those who do not use standard forms, sub-variational trends emerge: users of vestige forms vs. users of pan-northern forms. Other dimensions show micro oppositions amongst the pan-northern speakers or amongst the traditional speakers.
Figure 4: Schematization of the first two dimensions of MFA, used to highlight major and subtler variation patterns in sociophonetics
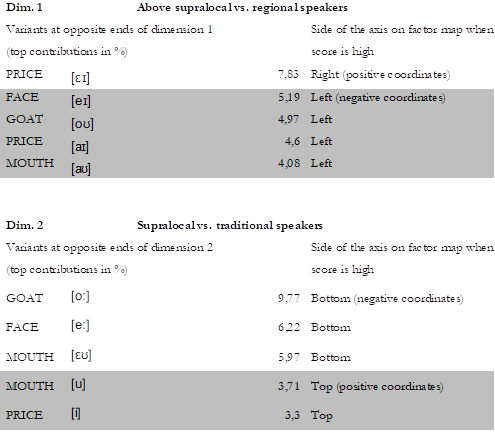
25Oppositions in variant use through dim. 1 & 2: the MFA diagnostics for dimension 1 (Table 2) highlight an opposition between the speakers who exhibit a very homogeneous variation pattern in all four vowels (the more socially prestigious forms), and the speakers who use the regional variant [ɛɪ] in price, but who do not necessarily use the same variants in face, goat and mouth. This means that there are two main groups: one who uses standard forms consistently across the 4 vowels, and another group whose speakers commonly favour [ɛɪ] in price significantly, but who distinguish themselves through the use of distinct regional forms. The opposition within the latter group is reflected in dimension 2, which reveals an opposition between the speakers who use the supralocal variants [eː] and [oː] in face and goat, plus the raised onset in mouth ([ɛʊ]), and those who exhibit the traditional variants of price [i] and mouth [u].
Table 2: Top 5 contributions of the phonetic variants to dimensions 1 (top) and 2 (bottom) along with the position of the variants on the dimension axes when variant use is above average
26Summary of both tables
27Dim. 1: (a) if you had to find one vowel that distinguishes typical Tyneside speakers from pan-northern speakers, take price and look for the raised onset; (b) when a speaker uses pan-northern forms, they seem to use them across the four vowels; (c) within the typical Tyneside speakers, there is a high degree of variation and sub-groups can be found through dimension 2.
28Dim. 2: (a) across typical Tyneside speakers two trends stand out: speakers with high scores of pan-northern forms in goat, face and mouth vs. speakers with vestigial forms in price and mouth.
29However, these covariational trends need to be confirmed through an inspection of the correlation between the variants, and groups of speakers, confirmed via a cluster analysis. This is dealt with in the next section.
3.3. Coherence across the 4 vowels and across speaker groups
- Note de bas de page 6 :
-
There were two monophthongal variants for mouth but [u] was used to label them both (TLS code: 01462 and 01464).
30Covariation patterns will now be examined in more depth via a correlation circle displayed in Figure 5 (left). Correlation circles are particularly useful for visualizing covariation amongst a high number of phonetic variants in two dimensions simultaneously. Variants are depicted in the form of arrows. The closer the arrows are to the rim of the circle, the better they reflect a clear opposition between speakers in one or both dimensions (Abdi and Williams, 2010). To ensure a better interpretability of the graph only the 12 phonetic variants with the highest contributions to dimensions 1 and 2 are labelled here6. Arrows forming acute angles are positively correlated (face [eə] & mouth [uː]). Obtuse angles indicate a negative correlation (raised vs. low onsets in price). Variants with no correlation form a right angle (goat [a] vs. face [eː]).
31Three main covariation patterns emerge: the top left part of the circle displays covariation amongst high prestige variants and the top right, amongst traditional ones. The bottom part of the graph shows a more supralocal type of variation with a raised onset in mouth and the pan-northern [eː] and [oː] in face and goat. The arrow for the raised onset in price [ɛɪ] is placed in between the pan-northern and traditional arrows. This means that many speakers from both groups use this raised onset.
Figure 5: correlation circle (left): coherence in variants & factor map (right): individual speakers their affiliation to a cluster
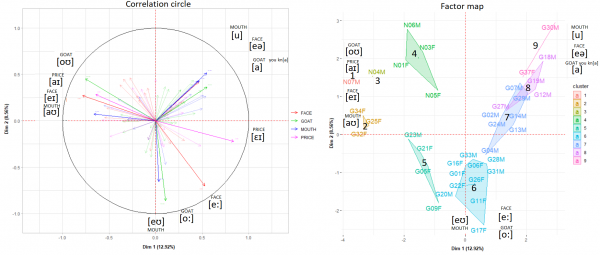
32The correlation circle confirms the output for dim. 1. Prestige variants covary: speakers who use closing diphthongs in goat and face, use low onsets for both price and mouth. The traditional variants that covary in a highly systematic way are the centring diphthong [eə] in face and two monophthongal realisations in mouth ([u]). The variant [a] for goat is also positively correlated with the traditional variants [eə] and [u]. The raised onset in mouth [ɛʊ] is strongly correlated with the pan-northern variant [oː] for goat. The pan-northern face variant [eː] is less strongly correlated with [ɛʊ] and [oː] because many traditional speakers use it too. This is also the case for the raised onset in price. The correlation circle, however, does not show individual speakers and limits itself to coherence amongst variants. Another graph with the same coordinates needs to be added to reveal the distances between each speaker.
33The right part of Figure 5 illustrates the distances between individuals and is called a factor map. This graph is the counterpart of the correlation circle and the two should ideally be interpreted side by side since they represent the same spectrums represented by dim. 1 and 2, albeit highlighting different aspects of the data, which is similar to the use of different filters on the same map. While the correlation circle highlights coherence within the variants chosen by speakers, the factor map places the speakers based on their overall variant usage. On the factor map, speakers with high percentage scores in one of the above-mentioned variants will be placed around where variants’ arrows are pointing in the correlation circle. Speakers with similar phonetic variation have similar coordinates (G22F and G26F). By contrast, G32F, G17F and G30M have very distinct pronunciation patterns. The closer the speakers are to where axes cross zero, the closer they are to the sample’s average variation pattern, e.g. G33M and G04M.
34Polygons circumscribe speakers that were grouped together in the cluster analysis. The coordinates of certain speakers suggest considering at least more than 6 groupings and setting apart atypical speakers that are placed far away from the rest of the sample (N07M or N04M). We now comment on the results of the cluster analysis.
3.4. Sub-linguistic norms in Tyneside English?
35How many dimensions retained for the clustering analysis? In order to analyse the clustering tendencies in more depth, the first five dimensions of the MFA were used as input for a cluster analysis–the eigenvalue for the sixth dimension was 1.01 and was disregarded as it was too close to the rule of thumb threshold of 1. The analysis was consolidated with k-means, so as to optimise group homogeneity (Lebart et al., 2000). After inspecting the sum of squares, it was decided to stop at the last large drop in units, namely, between 8 and 9 clusters, in order to have a better idea of the variational cohesion within and between these sub-groups. Going beyond that point would have led to overfitting (cf. Baayen, 2008).
Figure 6: classification of speakers. First letter of speaker index: N = Newcastle, G = Gateshead. Last letter: F = woman, M = man. Groupings are the same as Figure 3. Y-axis: the higher the node, the more different the overall variant patterns. X-axis: cumulative sum of speakers (n=44)
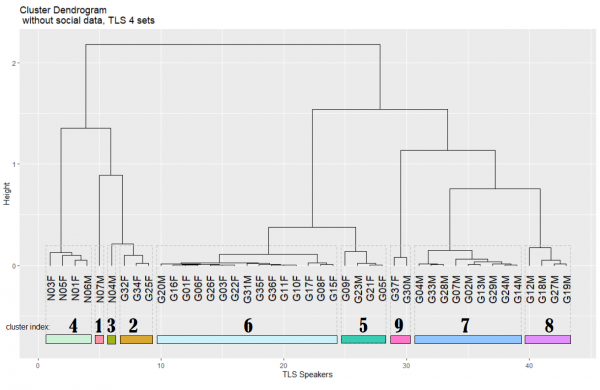
36What are the linguistic groups of speakers? Figure 6 illustrates the dendrogram resulting from the classification. It indicates that the speakers are divided into two main categories (cut-off point superior to 2, y-axis): the Newcastle speakers and all but three of the Gateshead speakers (G32F, G34F and G25F). The higher the split, the larger the difference between the speakers and the lower the split, the closer the speaker’s values approach the cluster’s average scores. Based on the MFA plots (Figure 3), we know that this reflects the opposition between the speakers with a higher share of prestigious variants and those exhibiting higher rates for the regional variants (dim. 1). The second major split (cut-off point of 1.5) is the one between the more traditional speakers and those who predominantly use pan-northern variants (dim. 2). Beyond oppositions defined in dim. 1 and 2, the speakers who use the prestigious variants can also be sub-divided into two categories, with N07M being considered an outlier. There are also three categories of traditional speakers and two for pan-northern ones. We now examine which clusters are correlated with one or more social factors.
- Note de bas de page 7 :
-
There were two distinct phonetically-trained transcribers from Newcastle University. Although both followed the same transcription schemes, minor differences in fine-grained transcriptions were observed. A more careful examination of these differences will be carried out in a future study.
- Note de bas de page 8 :
-
This issue is being investigated further since more information is being made available on the Newcastle speakers.
- Note de bas de page 9 :
-
The clusters are consolidated with k-means. This parameter has an impact on how clusters are made and on the final diagnostics.
37How do these groups correlate with social factors? Chi-square tests provided in the MFA + clustering output tables assess the link between the linguistic groupings and the social factors, here: class, age, gender, education and sampling area (Newcastle vs. Gateshead cohorts). The selected percentages given in this section are also found in the raw output tables. With the default level of group cutting, (i.e. 6 sub-groupings) one major effect is the city of residence (p = .009). This is partly due to variations in phonetic transcriptions7, and, potentially, to class8. Yet, the social factor that best helps discriminate speakers is gender (p = .003). This effect is clearly visible in Figure 4, with most speakers being grouped by gender. This suggests that in Tyneside English, there are distinct male and female linguistic norms reflected in the phonetic variants of face, goat, price, and mouth. With the 9 sub-groupings9: class, sex and city of residence significantly contribute to define at least one of these 9 groups (respectively p. < 000003, p < .003 and p < .03). Let us now examine what characterises these groups from a socio-linguistic point of view.
38Cluster 6 includes more speakers (n=14). It is predominantly female (p < 0.05, 13 women vs. 2 men) who did not pursue further education beyond minimum school leaving age (p < 0.05, 88.2% with no further education). This group extensively opt for the pan-northern variants [oː] and [eː] for goat and face and favour the raised onset in mouth [ɛʊ] (above 75% for the three variants). Both local and high prestige variants are avoided in this group as they remain below 6%.
39Pan-northern female speakers → monophthongs for goat and face, raised onsets for price and mouth. → highly coherent across the 4 vowels.
- Note de bas de page 10 :
-
Although the group includes a majority of women (3 women vs. 1 man), the group is too small for gender to be deemed a significant effect.
40By comparison, cluster 5 is exclusively composed of younger speakers from lower-middle class background and with further education (class: p = 0.003; education: p = 0.004; age: p = 0.004)10. Clusters 5 and 6 mainly differ in variant usage for mouth and price. While women with no further education in cluster 6 favour the raised onsets for both these vowels, the group of younger lower-middle class speakers used low onsets above 90% for mouth (except for G09F who uses the raised onset more than 60%). However, both groups predominantly use the pan-northern variants [oː] and [eː] for goat and face (except for G21F who has an equal share of prestige and pan-northern variants in face).
41Lower-middle class younger speakers → monophthongs for goat and face, raised onsets for price but low onset for mouth. → non-localised speech in mouth only.
42Clusters 7, 8 and 9 are almost exclusively composed of men, except for G37F in k9. Clusters 7 and 8 pattern in a similar way for face (37.1% vs. 38.3%) and price (37.6% vs. 44.0%) but cluster 8 is characterized by the significant, albeit infrequent use of the vestigial variant [u] in mouth (18.3%). In addition, two separate retracted mouth variants seem to define these two groups–cluster 7 [ɔʊ] 45.0%, cluster 8 [ʌʊ] 34.5%. An acoustic analysis along with a perception test should be carried out to assess the differences between the two variants. Cluster 9 groups two atypical speakers (G30M, G37F) who, combined, use [u] for mouth twice as much as cluster 8 (53.0% vs. 18.3%). These speakers also used significant amounts (ca. 11%) of rare variants like [ɪi] and [ɛʊ] for goat, and [ɪʊ] for mouth.
43Speakers using highly localised forms are predominantly men (except for G37F). But some speakers distinguish themselves through the use of [u] in mouth (k8 & k9), while others use retracted onsets [ɔʊ] or [ʌʊ] (k7 & k8). Working-class men form a continuum from broad to very broad (k7 → k8 → k9).
44Cluster 4 is exclusively composed of speakers from the Newcastle sample. It is defined by particularly high scores of [oʊ] in goat (65.6%) and two competing variants for face (pan-northern 11.5% vs. prestige form 17.8%). It has a large share of raised onsets in mouth (43.3%) and 10% of low onsets for price. Coherence in this group is less obvious because it is in between two linguistic profiles: pan-northern speakers and those using prestige forms.
45By opposition, cluster 2 uses the low onsets in mouth and price above 80%. This group also used the prestige variant [eɪ] in face more extensively than cluster 4 (k2: 74% vs. k4: 17.8%). It does not quite work in lockstep with goat ([oʊ] in 25%). Cluster 2 is only composed of three Gateshead women and none of the selected social variables significantly characterize the cluster due to its size. We hypothesise that cluster 2 forms the middle part of the female variation continuum ranging from non-localised (k4,1,3) to female pan-northern (k6 & k5).
4. Discussion
46In the Gateshead sample, variation is highly determined by gender: men use variants co-occurring amongst men only. The same is found for women, with a few rare exceptions (G37F, G20M). The broadless broad spectrum for Gateshead men ranges from pan-northern forms to vestigial forms. Women’s spectrum (except for G37F) goes along the line of pan-northernprestige forms. As expected, the common ground is pan-northern features used by both men and women, which is supported by the work of Haddican et al. (2013).
47In prestige and pan-northern variants for face and goat, co-variation is coherent whereas, for local variants, co-variation was harder to assess due to the wide array of variants reported for goat compared to those for face, which was mainly [eə]. In addition, the more frequent use of pan-northern [eː] for face amongst the traditional speakers indicate a looser symmetry between face and goat in the masculine and traditional sub-varieties of TE.
48price and mouth also co-varied tightly amongst most speakers using supralocal and high-prestige variants for face and goat. While users of supralocal forms for face and goat favour a raised onset for both price and mouth, speakers using high-prestige variants for face and goat can be divided into two sub-groups, i.e. those who use low onsets for both price and mouth and those using a low onset for mouth but a raised onset for price. The latter group corresponds to younger lower-middle class women who benefited from further education. Amand (2019, p. 513 ff.) investigated the interactional effect of class and age for the raised onset in mouth, which confirmed that, in the 1970s, the variant simultaneously indexes class and age in TE–young working-class women use the variant twice as much as their lower-middle class female counterparts (respectively > 80% vs. > 40%). However, this variant did not seem to index class amongst older women whose scores range between 70% and 80%. It is beyond the scope of this paper to elaborate upon age effects but it is possible that this age effect implies standard change with the low onset in mouth becoming the new local standard amongst women of both classes as the latter variant is more often used in read speech in the TLS and even more so in the read material of a 1990s corpus of TE (Amand, 2019). It is also possible that the low onset in mouth is simply an extension of the pan-northern coherence observed in goat and face to the mouth vowel.
49Raised onsets in price co-vary in a peculiar way since its covariation with pan-northern variants in goat and face and the raised onset in mouth does not prevent a simultaneous co-variation with the traditional variants of face, goat and mouth. This indicates that in the 1970s, a raised onset in price indexed class more than it did gender. These results are in line with Milroy’s study on a later corpus of TE (Milroy, 1996). It may also index an intermediate degree of localness encompassing both users of traditional forms of TE in other vowels and speakers with a more levelled form of TE in their use of pan-northern variants in face and goat.
50One regular pattern observed here is that the working-class women of the sample systematically score higher in the pan-northern variants of face and goat, which is in line with Watt’s study of conversational material from the TLS corpus (Watt, 1998). They nonetheless retain raised onsets in price and mouth; the former indexing class or localness, while the other seems to index both class/localness and gender. In addition, women form more coherent sociolects than men because their choice of variants for each vowel is more limited, which converges with Guy’s findings that women, contrarily to men, “consistently show co-varying usage of socially stratified variables” (Guy, 2013, p. 69). Nonetheless, men are also coherent in the sense that they systematically avoid the variants adopted by the less traditional women.
- Note de bas de page 11 :
-
The 1970s were a turning point for female educators. As Worth explains, “there was a marriage bar in place across much of the public sector until the 1940s and, crucially, part-time or more flexible roles were not widely available in the welfare professions until the 1970s”. She adds that “in the 1971 census, 381,000 women were studying under subjects classified as ‘education’, compared to only 140,000 men”.
51Interestingly, G20M, is an atypical speaker concerning mouth. He was the only man using the record score of 90% for the raised onset in mouth vs. an average of 36% amongst the other men. Buchstaller et al. (2017) analysed his realisations for face 42 years later, in a second sociolinguistic interview, in similar conditions to the original TLS interview. At the time of the first interview, he was a teacher trainee in his twenties and his face variants were almost categorically monophthongal. Given the increasingly high number of women trained as teachers in the 1970s (Worth, 2019)11, It is possible that G20M used the raised onset in mouth as a form of accommodation to his colleagues at work (cf. Coupland 1980 on style shifting in the work-place), a habit that was triggered by the semi-formal setting of the sociolinguistic interview, also known as the observer effect (Labov, 1972 and 1981). In the second interview, he had experienced considerable upward mobility and his realisations of face shifted towards “the most standard repertoire in the panel sample” (Buchstaller et al. 2017, p. 24), namely, the closing diphthong [eɪ]. G20M works in a language sensitive occupation (Chambers, 1994), in which the “legitimised language” plays an important role in shaping variation patterns amongst speakers, which may account for this remarkable shift. It is hypothesised that this change in face in favour of a more southern-like form is likely to be observable in mouth and price too, with a complete retrenchment from the use of the raised onsets for both vowels, and higher ratios of closing diphthongs for goat. A future study on coherence in face, goat, price and mouth on the second interviews of the six original 6 TLS speakers may provide insight as to how coherence evolves across the lifespan.
Conclusion
52This paper explored sociolectal cohesion within Tyneside English. In the Gateshead sample, four groups emerged as being sharply stratified by gender and social status. Although, at first sight, women seem more coherent in their variant use, men are also coherent in their own way. Women may treat socially stratified variants as discrete entities, i.e. opting for either one variant or another distinct one, whereas men seem to treat socially stratified variants as a continuum, thereby distinguishing themselves through the degree in which they exhibit traditional variants.
- Note de bas de page 12 :
-
The term Geordie refers to people from Newcastle and is often more closely associated with working-class men (Beal, 2009).
53Although certain linguistic groups seemed less coherent than others with regards to the four vowels under scrutiny, the average standard deviation for groups of more than two speakers ranged between 6 and 11%. The holistic model, “in which particular varieties or registers characterised by clusters of socially evaluated variables become identifiable in a community” (Guy, 2013), is supported by the fact that a certain number of speakers have MFA coordinates that approximate the centroids of a cluster in a factor analysis. They are what Pagès (2013) calls paragons, or the speakers with the average characteristics of the cluster they belong to, e.g. the cluster of “Geordie12” men: G14M, G13M, and G24M (respectively, former factory worker, former miner and former wire drawer, aged between 40 and 60). This means that these paragons’ variation patterns can form the basis of holistic representations of sociolinguistic sub-groups, with, at the periphery of clusters, innovators of sound change, social risers (G20M, the teacher trainee) and speakers that keep vestigial forms alive (G19M, the JCB driver or G37F, the factory worker).